http://www.ex-parrot.com/~chris/wwwitter/200504.html
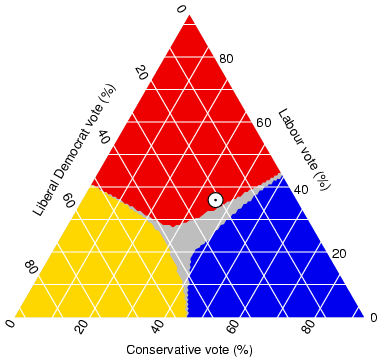
This is a triangular plot of a vote broken down by three different groups of people. As you can see, triangular plots are a good way to look at something like this because it shows the trend and the data at the same time. It is extremely easy to visualize.
No comments:
Post a Comment